U.S. Chemical Production Edged Higher in April

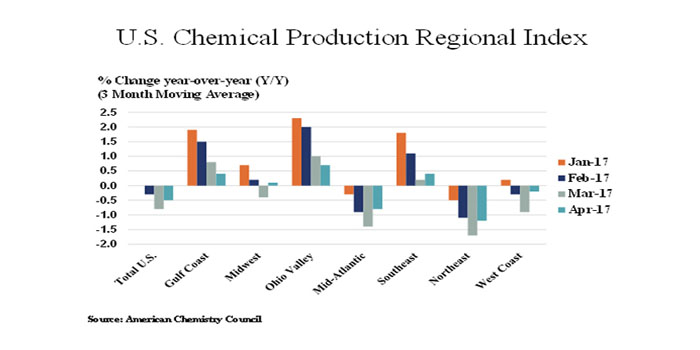
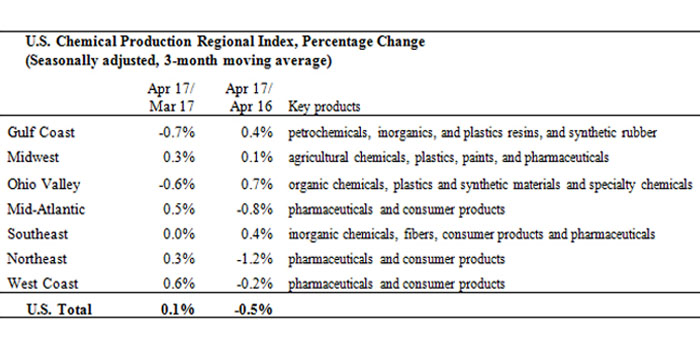
WASHINGTON – June 26, 2017 – According to the American Chemistry Council (ACC), the U.S. Chemical Production Regional Index (U.S. CPRI) edged higher by 0.1 percent in April, following revised flat growth in March, and a 0.3 percent decline in February, as measured on a three-month moving average (3MMA) basis. During April, growth in the Midwest, Mid-Atlantic, Southeast, Northeast and West Coast regions was offset by declines in the Gulf Coast and Ohio Valley regions.


Also measured on a 3MMA basis, chemical production was mixed. There were gains in the production average output trend of pharmaceuticals, fertilizers, coatings and adhesives. These gains were offset by declines in the output trend in synthetic rubber, pesticides, other specialties, plastic resins, consumer products, organic chemicals, chlor-alkali, industrial gases, other inorganic chemicals, and manufactured fibers.

Nearly all manufactured goods are produced using chemistry in some form or another. Thus, manufacturing activity is an important indicator for chemical production. On a three-month-moving average basis, manufacturing activity edged higher 0.3 percent in April, its sixth consecutive gain. Production expanded in several chemistry-intensive manufacturing industries, including food and beverages; motor vehicles and parts; construction supplies; machinery; fabricated metal products; computers and electronics; petroleum refining; foundries; plastic products; paper; printing and textile products.
RELATED Lapolla Industries Introduces All-New FOAM-LOK 400 Ultra High-Yield, Energy-Efficient Spray Polyurethane Foam Insulation, Polyurethane Professional Celebrates 50 Years
Compared to April 2016, U.S. chemical production was off by 0.5 percent on a year-over-year basis, an improving trend. Chemical production was off from year ago levels in the Mid-Atlantic, Northeast, and West Coast regions. The Gulf Coast, Midwest, Ohio Valley and Southeast regions were up on a Y/Y basis.

The chemistry industry is one of the largest industries in the United States, a $797 billion enterprise. The manufacturing sector is the largest consumer of chemical products, and 96 percent of manufactured goods are touched by chemistry. The U.S. CPRI was developed to track chemical production activity in seven regions of the United States. The U.S. CPRI is based on information from the Federal Reserve, and as such, includes monthly revisions as published by the Federal Reserve. To smooth month-to-month fluctuations, the U.S. CPRI is measured using a three-month moving average. Thus, the reading in April reflects production activity during February, March, and April.
Disqus website name not provided.


